Merged Bottle and CTD Data
This dataset contains Niskin bottle measurements of multiple water quality parameters paired with dissolved oxygen extracted from CTD profiles collected during South Florida Ecosystem Restoration (SFER) cruises since 2014. This provides a standardized, quality-checked data table with matched physical and biogeochemical variables per station, depth, and time stamp, enabling the analysis of multiple stressor conditions affecting South Florida's habitats. Stressor parameters include water column temperature, dissolved inorganic nutrients, chlorophyll-a, carbonate chemistry variables (dissolved inorganic carbon, total alkalinity, pH), and dissolved oxygen (CTD). The data can be filtered by station ID and time period, and results are cataloged as a CSV file. An interactive map presents the merged stressor observations and links to CSV downloads. An API enables data access via query parameters.
The results are cataloged here and are available as a CSV attachment. An interactive website, pictured below, presents the merged results and links to CSV downloads.
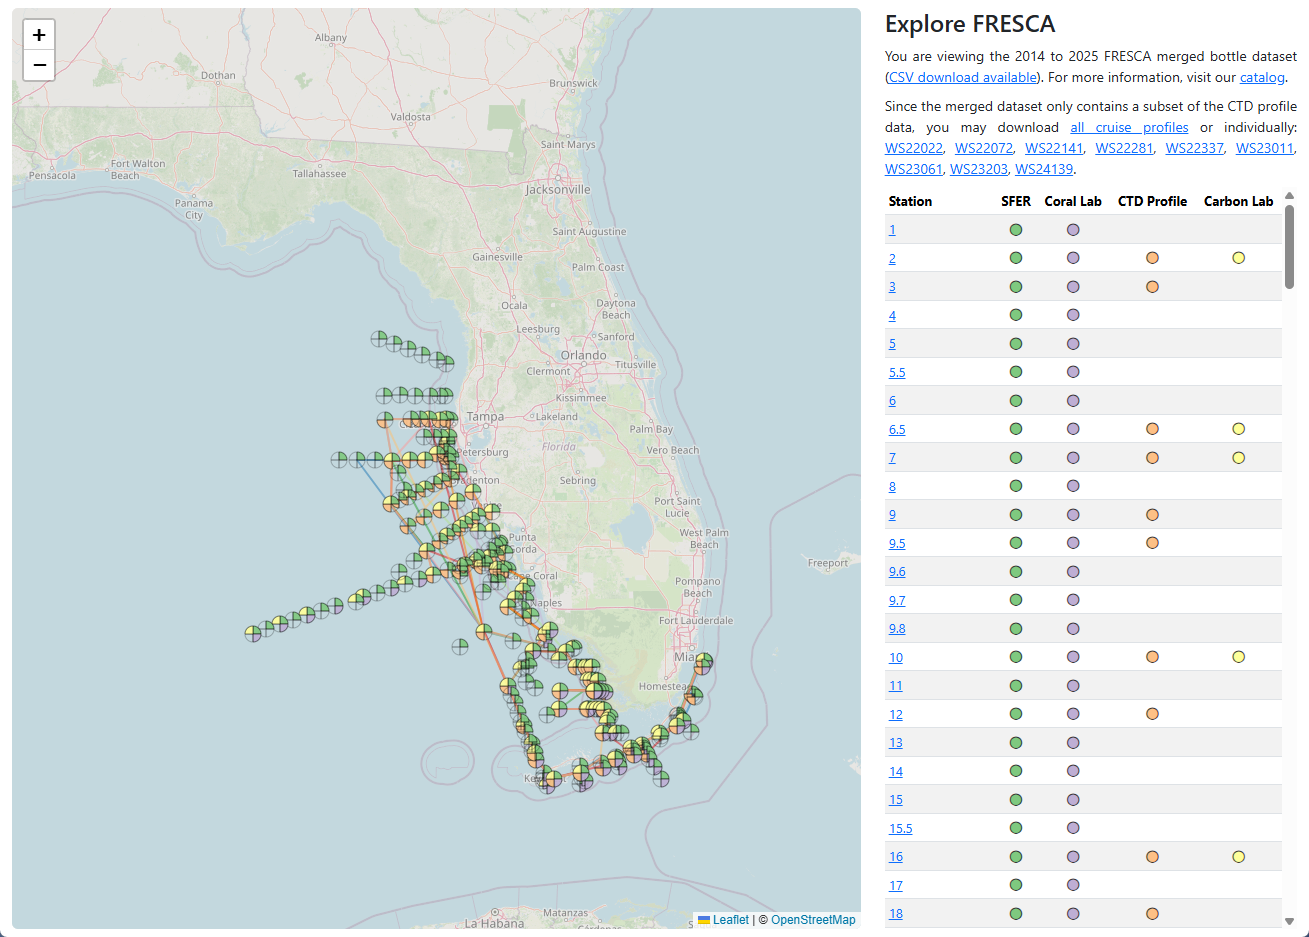
The first successful test case was to collect 2023 Station 21LK data. The merged data can be viewed in this spreadsheet.
| Data Source | Raw Data | Update Frequency | Comments |
|---|---|---|---|
| SFER | Internal CSV | Every 2 months (approximately 1 month behind cruise schedule) | For more information, contact TBD. |
| Coral Lab | Internal database | Weekly (post-SFER update) | For more information, contact TBD. |
| Carbon Lab | CSV's from AOML | TBD | TBD |
| CTD profiles | GCOOS ERDDAP | TBD | QA/QC flags were available in the GCOOS ERDDAP, but they were not observed as part of the ingestion process. |
SFER data was chosen to dictate the station names, times, depth(s), and positions that would be used to search for and ultimately merge the datasets. Only a predefined set of parameters were selected to appear in the final merged dataset.
| Column Name | Data Source | Description |
|---|---|---|
| t_utc | SFER | Sample date (UTC) |
| station_id | SFER | Station ID |
| sfer_cruise_id | SFER | Cruise ID |
| longitude | SFER | Longitude (DD East) |
| latitude | SFER | Latitude (DD North) |
| sfer_depth | SFER | Depth (m) |
| sfer_temp | SFER | Temperature (Flowthrough site=Ship sensor, CTD site=CTD Sensor) (C) |
| sfer_sal | SFER | Salinity (Flowthrough site=Ship sensor, CTD site=CTD Sensor) (PSU) |
| sfer_nh4 | SFER | Ammonium (umol/L) |
| sfer_po4 | SFER | Phosphate (umol/L) |
| sfer_no3_no2 | SFER | Nitrate + Nitrite (umol/L) |
| sfer_no3 | SFER | Nitrate (umol/L) |
| sfer_no2 | SFER | Nitrite (umol/L) |
| sfer_si | SFER | Silicate (umol/L) |
| sfer_chl | SFER | Chlorophyll a (two filters per sample tube averaged) (ug/L) |
| coral_lab_sample_depth_m | Coral Lab | Depth (m) |
| coral_lab_dic_umol_kg | Coral Lab | DIC (umol/kg) |
| coral_lab_ta_umol_kg | Coral Lab | TA (umol/kg) |
| coral_lab_spec_ph_measured | Coral Lab | pH |
| coral_lab_salinity | Coral Lab | Salinity (PSU) |
| ctd_do | CTD Profiles | Dissolved Oxygen (ml l-1) |
| ctd_sea_water_pressure | CTD Profiles | Pressure (dbar) |
| ctd_sea_water_temperature | CTD Profiles | Temperature (Degree Celsius) |
| ctd_sea_water_electrical_conductivity | CTD Profiles | Conductivity (S m-1) |
| ctd_sea_water_salinity | CTD Profiles | Sea Water Salinity (TBD) |
| ctd_chlorophyll_fluorescence | CTD Profiles | Seapoint Chlorophyll Fluorescence (ug l-1) |
| ctd_cdom | CTD Profiles | CDOM concentration from Fluorescence, WET Labs CDOM (mg m-3) |
| ctd_depth_m | CTD Profiles | Depth (m) |
| carbon_dic | Carbon Lab | TBD |
| carbon_ta | Carbon Lab | TBD |
| carbon_ph | Carbon Lab | TBD |
| carbon_depth_m | Carbon Lab | TBD |
Post-Processing
The data is merged according to these criteria:
- Station ID
- Year-Month-Day
- Depth
Station ID’s were not always consistent across data sources, and time will tell how these matches can / should be improved. Depths, however, were a different challenge. SFER data at a particular station and point in time usually had two depths. In order to find a similar value from the CTD profile data, parameters were averaged based on at most 10 observations above and below the SFER depth.
Issues
Collecting the data from the Carbon Lab and GCOOS ERDDAP was cumbersome since the target data was stretched across multiple files. Ultimately, almost all of the Carbon Lab CSV's were collected and put into the staging database. Similarly, there were many GCOOS ERDDAP endpoints which matched the SFER area of interest, and they, too, were collected and put into the staging database.
Data Quality: TBD