Biomatrix
The main purpose for this matrix is to easily make figures and statistical comparisons across biological parameters, species, and treatments. For example, to answer the question: how do photosynthesis and respiration rates (two different biological parameters, Bucket #1) for Acer, Ssid, and Ofav (different species run in different rounds of experiment 1) compare at a pH of 7.7 (one of the treatment levels for experiment 1)? it would be useful to have all this information in one singular spreadsheet that to load into R for easy visualization and statistical analysis.
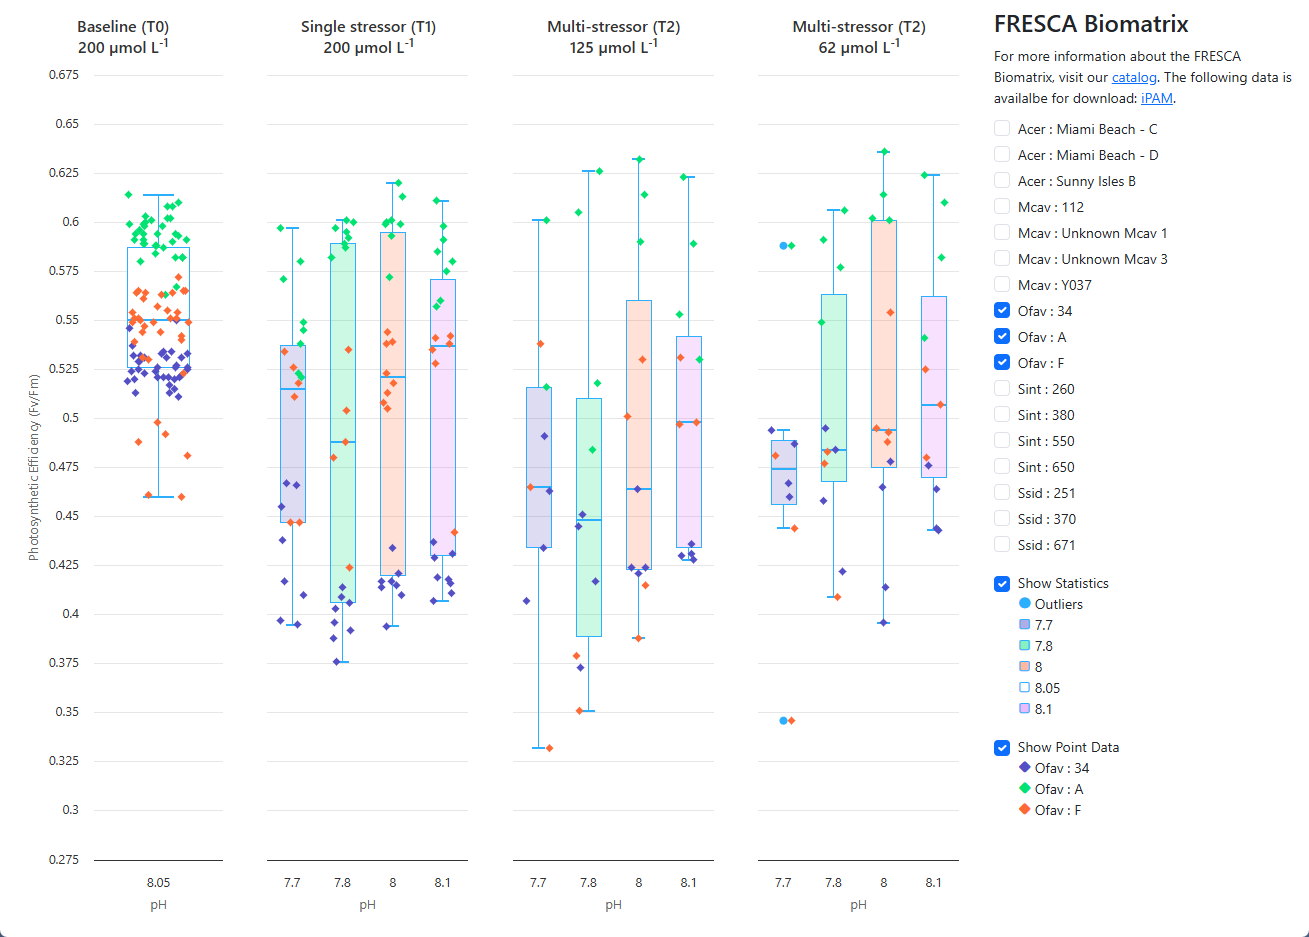
An interactive website, pictured below, is available for users to create graphs of biomatrix data on-demand.
Pre-Processing
When experimental data has been finalized, FRESCA personnel will add it to this Google Sheet as a new tab.
Post-Processing
The data manager will run a script to synchronize the Google Sheet with the biomatrix web service described below.
Data Access
A recent snapshot of the merged data is available as an attachment to this catalog entry.
Users may also access CSV and JSON downloads on-demand via a biomatrix web service.
- Download all data as CSV, https://api.fresca.2creek.com/csv/get_ipam_data.
- Download all data as JSON, https://api.fresca.2creek.com/json/get_ipam_data
Users may filter the data according to these rules.
- Download iPAM data with a pH of 7.7 in CSV format: https://api.fresca.2creek.com/csv/get_ipam_data?ph=eq.7.7
- Download iPAM data with a pH of 7.7 in JSON format: https://api.fresca.2creek.com/json/get_ipam_data?ph=eq.7.7